SUMMARY OVERVIEW (Presented at TRB January 25, 2007)At the 2007 TRB Annual Meeting, these presentations provided a summary of the presentations from the 5th International Visualization in Transportation Symposium and Workshop.
 Introduction Introduction
Michael Manore, P.E. – Chair, TRB Visualization Committee
 Audio/Visual Presentation Audio/Visual Presentation
 Special Executive Session Summary Special Executive Session Summary
Barbara Harder – Principal, B.T. Harder, Inc.
Audio/Visual Presentation
 Presentation Overviews Presentation Overviews
Charles Hixon, III – Synthesis Consultant, Bergmann Associates, Inc.
Audio/Visual Presentation
 Research Agenda Summary Research Agenda Summary
Dr. Ron G. Hughes – ITRE-NCSU
Audio/Visual Presentation
|
This synthesis presents information on visualization; the visual representation of proposed
alternatives and improvements and their associated effects on the existing surroundings.
It focuses on the best practices and experiences to date within transportation agencies
that are developing and incorporating visualization into the project development process.
The report provides an overview, details case studies, addresses the challenges of visualization,
and compares the results with a similar study from 1996.
This synthesis report was developed by conducting interviews with various transportation
agencies, universities, and consultants throughout the United States. A survey questionnaire
was distributed in advance of the interviews to assist in the preparation. |
SPECIAL EXECUTIVE SESSION 01 (MONDAY) This special half-day working session was exclusively for upper and executive management professionals in
the highway transportation industry.
• Opening & Introductions
Michael Manore – Chair, TRB Visualization Committee
• Welcome & Objectives Overview
Tom Norton & Cynthia Burbank
• Overview of Visualization Technologies & NCHRP 36-04 Findings “Visualization in Project
Development”
Charles Hixon, III, Synthesis Consultant, Bergmann Associates, Inc.
• Facilitated Discussion on Issues and Needs for Decision-makers
Barbara Harder – Principal, B.T. Harder, Inc.
Special Executive Session Summary (From TRB 1/25/07)
Barbara Harder – Principal, B.T. Harder, Inc.
Audio/Visual Presentation
|
There are three primary objectives of this session:
- To provide an executive overview of the technology and state of practice regarding visualization;
- To facilitate an interactive discussion regarding current and evolving issues in delivering our
transportation programs;
- Explore the potential of visualization to assist in delivering those programs.
This session is open to leaders in federal, state, and local agencies, as well as those in consulting,
construction, and academic organizations.
|
|
|
OPENING SESSION 02 (MONDAY) Symposium Opening Welcome
Dr. Richard Pain – Transportation Research Board
Overview and Intent of the Symposium
Mr. Michael Manore, P.E. – Chair, TRB Visualization Committee
 Colorado Welcome and Opening Perspectives Colorado Welcome and Opening Perspectives
Mr. Tom Norton, P.E., Executive Director, Colorado Department of Transportation
Audio/Visual Presentation
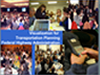 Update on SAFETEA-LU Requirements Update on SAFETEA-LU Requirements
& Perspectives on Visualization for Planning
Ms. Cynthia Burbank, Associate Administrator, Federal Highway Administration
Office of
Planning, Environment, and Realty
Audio/Visual Presentation
 Decision-Making and Public Engagement from a Multi-Modal Planning Perspective Decision-Making and Public Engagement from a Multi-Modal Planning Perspective
Charles Goodman, Director of Systems Planning, FTA Office Planning & Environment
Audio/Visual Presentation
• Regional Council Perspectives on Visualization -
Tom Boone – Denver Regional Council of Government
NO PRESENTATION
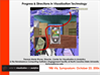 Progress & Directions in Visualization Technology Progress & Directions in Visualization Technology
Teresa-Marie Rhyne, Director, Visual Analytics Institute, NCSU
Audio/Visual Presentation
 The Ultimate Purpose of Visualization The Ultimate Purpose of Visualization
Jeff Coleman, Manager
Bob Singerman, Business Development Manager - URS Corporation
Audio/Visual Presentation
|
|
PLANNING TRACK 03 (TUESDAY)  Scenario Planning for Idaho’s 30-Year Transportation Vision Scenario Planning for Idaho’s 30-Year Transportation Vision
Mr. Dave Biggs, Co-founder, Envision Sustainability Tools - MetroQuest
Audio/Visual Presentation
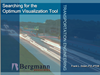
 Visualizing Metra: An Interactive Visualization Tool Visualizing Metra: An Interactive Visualization Tool
Ms. Laxmi Ramasubramanian, Hunter College
Ms. Sue McNeil, University of Delaware
Audio/Visual Presentation
 Paper Paper
 Multimedia Use in Visualization of Transportation Projects: Multimedia Use in Visualization of Transportation Projects:
From Project
Pursuits to Client Reviews and Public Information
Mr. Jesse Miguel, HNTB Corporation
Audio/Visual Presentation
Paper
|
|
ENGINEERING TRACK 04  Value of Visualization within an Engineering Consulting Firm Value of Visualization within an Engineering Consulting Firm
Mr. Paul Brown, Parsons Brinckerhoff, Cardiff, UK
Audio/Visual Presentation
Paper
 3D Visualization and Micro-Simulation Applied to the Identification and
Evaluation of Geometric and Operational ‘Solutions’ for Improving Visually
Impaired Pedestrian Access to Roundabouts and Channelized Turn Lanes 3D Visualization and Micro-Simulation Applied to the Identification and
Evaluation of Geometric and Operational ‘Solutions’ for Improving Visually
Impaired Pedestrian Access to Roundabouts and Channelized Turn Lanes
Dr. Ron Hughes, ITRE-NCSU
Audio/Visual Presentation
Presentation Paper
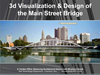 A Tandem Effort: Balancing Architectural Desires with Structural Needs A Tandem Effort: Balancing Architectural Desires with Structural Needs
Mr. Michael Mundy, HNTB Corporation
Audio/Visual Presentation
|
|
PLANNING TRACK 05  A Visualization Experience of the Northern Illinois Planning Commission A Visualization Experience of the Northern Illinois Planning Commission
Yukun Dong, University of Delaware
Audio/Visual Presentation
Paper
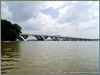
 Towards an Advanced Spatial-Temporal Visualization System for the
Metropolitan Washington D.C. Towards an Advanced Spatial-Temporal Visualization System for the
Metropolitan Washington D.C.
Dr. Chang-Tien Lu, Virginia Polytechnic Institute and State University
Audio/Visual Presentation
Paper
 Various Uses of Color in 3D Visualizations to Demonstrate Traffic
Operations to Decision-makers and the Public Various Uses of Color in 3D Visualizations to Demonstrate Traffic
Operations to Decision-makers and the Public
Mr. Mark Yedlin, KLD Associates, Inc.
Audio/Visual Presentation
|
|
ENGINEERING TRACK 06 Using Visualization for the Design Process of Rural Roads Using Visualization for the Design Process of Rural Roads
Dr. Wolfgang Kuhn, University of Leipzig, Germany
Audio/Visual Presentation Paper
 Rapid 3-D Modeling and Simulation of Underground Transportation Rapid 3-D Modeling and Simulation of Underground Transportation
Structures
James Kainz, Applied Research Associates
Audio/Visual Presentation
3D/4D/nD Modeling Real-time Visualization in Transportation
Mr. Doug Eberhard, Parsons Brinkerhoff
PRESENTATION NOT INCLUDED BY REQUEST OF SPEAKER
|
|
PLANNING TRACK 07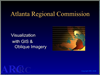 Atlanta Regional Commission Uses Oblique Imagery to Help New Orleans
Recovery Effort Atlanta Regional Commission Uses Oblique Imagery to Help New Orleans
Recovery Effort
Mr. Art Kalinski, Atlanta Regional Commission
Audio/Visual Presentation
Paper
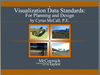 Visualization Data Standards for Planning & Design Visualization Data Standards for Planning & Design
Mr. Cyrus McCall, McCormick Taylor, Inc.
Audio/Visual Presentation
Paper (13MB)
 Delivering the NY Transit System Advertising System to NYC Delivering the NY Transit System Advertising System to NYC
Ms. Erin May, URS Corporation
Audio/Visual Presentation
|
|
ENGINEERING TRACK 08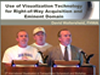 Use of Visualization Technology for Right-of-Way Acquisition and Eminent
Domain – Use of Visualization Technology for Right-of-Way Acquisition and Eminent
Domain –
Mr. David Walterscheid, Federal Highway Administration
Audio/Visual Presentation
 A Four-D, Real-Time, Transportation Visualization System A Four-D, Real-Time, Transportation Visualization System
Mr. Michael Pack, Center for Advanced Transportation Technology
Audio/Visual Presentation
Paper
 Leveraging of Civil Data Models During Construction Leveraging of Civil Data Models During Construction
Mr. Paul DiGiacobbe, Nave Newell, Inc.
Audio/Visual Presentation
|
|
PLANNING TRACK 09 Visualization and Practices for Regional Planning
Panelists:
 Dave Biggs, Co-Founder, MetroQuest. Dave Biggs, Co-Founder, MetroQuest.
Audio/Visual Presentation
Paper
 Donald McAuslan, Transportation Planner II, Metropolitan Washington COG Donald McAuslan, Transportation Planner II, Metropolitan Washington COG
Audio/Visual Presentation
• Darren Smith, Transportation Planner I, Metropolitan Washington COG
NO PRESENTAITON
 Ted Knowlton, Planning Director, Envision Utah Ted Knowlton, Planning Director, Envision Utah
Audio/Visual Presentation
|
Description: SAFETEA-LU requires that we use visualization to describe plans as
part of the Public Participation Plan requirement in Metropolitan and Statewide
Transportation Planning. This session will highlight two visualization techniques that
have helped regions describe their transportation visions and goals.
Interactive planning support tools facilitate the creation of sustainable visions, and
support the implementation of transportation plans. MetroQuest is a proven approach for
urban and regional planning that can turn stakeholders into constructive partners.
MetroQuest is one of the leading software tools that can be used to visualize regional growth issues. Through workshops, participants balance dozens of priorities in areas such
as transportation, housing development and environmental stewardship. Envision Utah
used visualization throughout the process to involve key decision-makers and the
community to gain support at the ground level. Building grass roots support for your
transportation plan will ensure its successful implementation. Envision Utah provided
critical technical information to help analyze the impacts of growth on transportation, air
quality, land use, water supply/demand, and infrastructure costs. Through the
involvement of the public, local and state elected officials, the business, civic, and
religious communities, and other key stakeholders, Envision Utah gathered information about what Greater Wasatch Area residents value and how they think growth should be
accommodated. |
ENGINEERING TRACK 10 An Efficient Means for Prototyping and Reviewing Roadway Designs
Through Visualization
R. Wade Allen, Systems Technologies, Inc.
 Mr. Michael Pack, Center for Advanced Transportation Technology Mr. Michael Pack, Center for Advanced Transportation Technology
Audio/Visual Presentation
 3D Modeling for Lighting Visualization for Enhanced Safety 3D Modeling for Lighting Visualization for Enhanced Safety
Paul Lutkevich & Christopher Leone, Parsons Brinkerhoff
Audio/Visual Presentation
Paper
 The Use of Simulation Visualization as an Aid to Roadway Design The Use of Simulation Visualization as an Aid to Roadway Design
Tom Granda, Ph.D., Turner-Fairbank Highway Research Center
Audio/Visual Presentation
Paper (Very Large File: 148MB)
|
|
ENGINEERING TRACK 11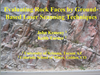 Evaluating Rock Faces by Ground-based laser Scanning Techniques Evaluating Rock Faces by Ground-based laser Scanning Techniques
John Kemeny, University of Arizona
Co-Author - Dr. A. Keith Turner, Colorado School of Mines
Audio/Visual Presentation
 Using Ground Based Rotating LIDAR for 3D Viewing and Measuring Using Ground Based Rotating LIDAR for 3D Viewing and Measuring
Laurence Rohter, P.E. Illinois Institute of Technology; Chicago, US
Ray State, Spion Services Ltd; Nottingham, UK
Stirling Kimkeran, Omnicom Engineering Ltd; York, UK
Audio/Visual Presentation
Paper
 FHWA’s Digital Highway Measurement and Ground Penetrating FHWA’s Digital Highway Measurement and Ground Penetrating
Radar Technologies Michael Trentacoste, Turner Fairbank HRC
Audio/Visual Presentation
|
|
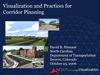
PLANNING TRACK 12 (Wednesday) Visualization and Practices for Corridor Planning
 Chuck Donle, Donley & Associates, Inc. Chuck Donle, Donley & Associates, Inc.
Audio/Visual Presentation
 Wendy Wallach, Carter Burgess Wendy Wallach, Carter Burgess
Audio/Visual Presentation
• Dony Dawson – Carter Burgess
PRESENTATION NOT INCLUDED
 David Hinnant, North Carolina DOT David Hinnant, North Carolina DOT
Audio/Visual Presentation
|
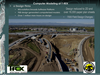
Description: Visualization tools can be used in planning transportation corridors.
Carter & Burgess employed techniques during the design-build of the Transportation
Expansion (known as T-Rex) Project in Denver. Visualization provided a highly accurate
method of examining alternatives at the design stage, when options are most open. The T-REX
project includes the reconstruction of 16.5 miles of two interstate highways and the
design and construction of 19 miles of light rail transit. Design Visualization created
engaging, believable imagery, providing a window into the future so the public could
actually picture, and help others picture, how this project would unfold.
Donley & Associates uses real time visualization in roadway planning to evaluate road
alignments, lane configurations and potential traffic study demands/loads. The analysis
results can inform the design process and citizen involvement. Skilled users can produce
simple, but useful visualizations in just a few minutes as Donley & Associates describes.
Off the shelf software packages include Google Earth, CommunityViz's SiteBuilder3D,
and ESRI's ArcScene/ArcGlobe.
Each system differs in GIS compatibility, visual quality and ease of use. The sample
project depicts a proposed road alignment located southeast of Durango. The road
connects the proposed 3 Springs development with Ewing Mesa and it provides an
alternate route for traffic on US 160 and US 550. |
ENGINEERING TRACK 13 Advancements in Surveying & Remote Sensing
• James V. Flint, Vice President, Laser Geomatics - Bohannan Huston, Inc.
NO PRESENTATION
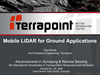 Paul Mrstik, Vice President, Engineering, Terrapoint Canada, Inc. Paul Mrstik, Vice President, Engineering, Terrapoint Canada, Inc.
Audio/Visual Presentation
• John Kemeny, Ph.D., Associate Professor, Dept. of Mining and Geological
Engineering, University of Arizona
SEE SESSION 11
|
Description: This session will review how laser scanning, airborne LIDAR, GPS and
traditional survey integrated with CAD and GIS impacts project safety, schedule, quality
and cost for the design, construction and operation of transportation infrastructure assets. |
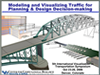
PLANNING TRACK 14 Modeling Traffic for Planning & Design Decision-making
 Thomas R.. Furlani, University at Buffalo Thomas R.. Furlani, University at Buffalo
Modeling Traffic for Planning & Design Decision-making
Audio/Visual Presentation
 Frank L. Dolan, P.E., PTOE, Bergmann Associates Frank L. Dolan, P.E., PTOE, Bergmann Associates
Audio/Visual Presentation
 Matthew Martimo, Citilabs Matthew Martimo, Citilabs
Audio/Visual Presentation
 Mark Yedlin, KLD Associates, Inc. Mark Yedlin, KLD Associates, Inc.
Audio/Visual Presentation (not complete)
Paper
|
Description: This session will overview developments relating to traffic modeling and
visualization in order to provide a context for open discussion. Panelists and Moderator
will draw on prior experience and will discuss future trends and where they believe the
technology is headed. After the presentations, the panel will engage the audience in
discussing some of the challenges and interests associated with modeling and visualizing
traffic along with the utility this capability provides for the planning, design, and
approval process. |
PLANNING TRACK 15 Visualization and Practices for Neighborhoods, Projects , & Places
 Doug Walker, President, Placeways - CommunityViz Doug Walker, President, Placeways - CommunityViz
Audio/Visual Presentation
 Chase Mullins, 3D Visualization Specialist, Winston Associates Chase Mullins, 3D Visualization Specialist, Winston Associates
Audio/Visual Presentation
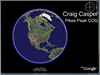 Craig Casper, Director, Transportation Program - Pikes Peak COG Craig Casper, Director, Transportation Program - Pikes Peak COG
Audio/Visual Presentation
|
Description: Probably no where else does the use of Visualization techniques affect
planning more closely than at the Neighborhood, Project Level. However, transportation
planning is seldom thought of as a visual process. Often, transportation decisions are
made on the basis of engineering plans or diagrams, with the focus primarily on traffic or
alignment considerations. At the same time, these designs have a big impact on the
livability of the street and the community. We seek public input when making
transportation decisions, but there is typically little ability for understanding and
visualizing what the choices really are. Through the use of visualization techniques like
GIS-based analysis, 3D visualization tools, and Google Earth, communities are provided
with new exciting tools that allow them to envision land use alternatives, understand their
potential impacts, explore options, and share possibilities. The ability to truly show how
transportation relates to its surroundings is vital to reaching consensus, overcoming
objections and in accelerating the review process with town councils and the public. This
session will present a number of examples of how various affordable visualization tools
can lead to better decision-making, especially when coupled with design charrettes and
other public engagement venues. A panel of experts from CommunityViz, Winston
Associates, and the Pikes Peak Council of Governments will highlight these tools and
how they are used in transportation planning and project decision-making. |
ENGINEERING TRACK 16 Progress in Context Sensitive Solutions and Visualization
 Lisa Olszak, President, Olszak Management Consultants, Inc. Lisa Olszak, President, Olszak Management Consultants, Inc.
Audio/Visual Presentation
 Angelo Papastamos, CSS Director, Utah Department of Transportation Angelo Papastamos, CSS Director, Utah Department of Transportation
Audio/Visual Presentation
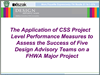
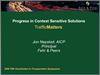 Jon Nepstad, Principal, AICP, Fehr & Peers Jon Nepstad, Principal, AICP, Fehr & Peers
Audio/Visual Presentation
|
Description: This Panel Discussion will focus on the higher level applications of
visualization within the Context Sensitive Solutions (CSS) process. Issues such as: How
is Visualization used within the CSS process? What is the process to introduce
visualization and obtain approvals for its use? What is the funding process? How can
Visualization be monitored and measured within the CSS process? and, What team
members are needed to utilize Visualization within the CSS process? will be addressed
(along with others) during this panel discussion. |
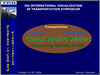
ORGANIZATIONAL TRACK 17 Opportunities and Challenges in Transportation Data Visualization
 Tim Case, Parsons Brinkerhoff Tim Case, Parsons Brinkerhoff
Audio/Visual Presentation
 Thomas R.. Furlani, University at Buffalo Thomas R.. Furlani, University at Buffalo
Audio/Visual Presentation
 Harvey J. Miller, University of Utah Harvey J. Miller, University of Utah
Audio/Visual Presentation
|
Description: Transportation research and application are moving from a data-poor to a
data-rich environment. New technologies such as intelligent transportation systems,
location aware technologies (e.g., the global positioning system), video cameras, satellite
and airborne remote sensing, automated toll systems, and so forth, are greatly increasing
the volume and scope of transportation data. The cost of storing and sharing these data is
decreasing due to increasing capabilities for data warehousing and data infrastructures.
The continuing geometric growth of computing power and is also improving the means
for transportation data processing.
Despite these growing potentials, there is still a widespread feeling among transportation
researchers and practitioners that we are “drowning in data” rather than exploiting it to its
fullest extent. Many of the traditional analytical tools used in research and practice were
developed in an era of scarce data and weak computing: they can only scratch the surface
of the vast information space implied by these data. These unrealized capabilities are apparent at the same time when there is a critical need for new thinking about the major
challenges facing transportation over the next decade, such as congestion, safety,
security, infrastructure renewal and the environment.
Data visualization and improved interoperability offers potential for making sense of the
large volume of data being collected about transportation systems. The insights gained
through deeper and more holistic exploration of transportation data can generate new
ways of thinking about and analyzing transportation systems and their challenges. This
panel will bring together leading experts in transportation data visualization to discuss its
opportunities and challenges in basic research and application. |
ENGINEERING TRACK 18 Using Simulator Technologies to Improve Safety in Designs and Work Zones
Introduction: Wade Allen, Systems Technology, Inc.
Audio/Visual Presentation
 National Advanced Driving Simulator National Advanced Driving Simulator
Shawn Allen
Audio/Visual Presentation
 HumanFIRST Program HumanFIRST Program
Peter Easterlund
Tom Granda, Federal Highway Administration
Audio/Visual Presentation
Paper (91MB)
 Michael Kelly, Western Transportation Institute Michael Kelly, Western Transportation Institute
Audio/Visual Presentation
Paper
 Yiannis Papelis, Center for Advanced Transportation Systems Simulation Yiannis Papelis, Center for Advanced Transportation Systems Simulation
Audio-Only Presentation
|
Description: Driving simulation (immersive and desktop) promote a higher level of
safety assessment and review of roadway projects. This panel session will summarize
past, current and potential applications. Open discussion with the audience will be
encouraged regarding utility of this approach, how to achieve this capability in various
agencies, and the potential for wider adoption of these techniques. |
ENGINEERING TRACK 19 (Bridge) Visualization for Bridge Design, Fabrication, and Construction
 Krishna Verma, Principal Bridge Engineer, Federal Highway Administration Krishna Verma, Principal Bridge Engineer, Federal Highway Administration
Audio Presentation (Audio Only, no visuals)
 Asif Habibullah, Director, CSRI Asif Habibullah, Director, CSRI
Audio/Visual Presentation
Michael Mundy – Bridge Architect, HNTB
NO PRESENTATION
 Jeff Coleman, Manager, Creative Imaging, URS Corporation Jeff Coleman, Manager, Creative Imaging, URS Corporation
Audio/Visual Presentation
Pingsha Dong – Technical Director, Battelle
PRESENTATION NOT INCLUDED AT REQUEST OF PRESENTER
Luke Faulkener, Director of Technology Initiatives, AISC
NO PRESENTATION AVAILABLE
|
Description: This session will look to present and discuss advancements,
opportunities, and issues relating to the extension of 3D data into bridge
fabrication and construction practices. |
ORGANIZATIONAL TRACK 20 Employing Visualization Organizationally
Chuck Hixon, III, Bergmann Associates
 Doug Walker, Placeways, LLC Doug Walker, Placeways, LLC
Audio/Visual Presentation
 Kevin Gilson, Parsons Brinkerhoff Kevin Gilson, Parsons Brinkerhoff
Audio/Visual Presentation
Paper
 Steve Braun, Florida Department of Transportation Steve Braun, Florida Department of Transportation
Audio/Visual Presentation
|
Description: This session will discuss visualization in the context of the organizational
considerations. More specifically: How is visualization employed within the
organization? What is the process to introduce visualization and obtain approvals for its
use? How can visualization be monitored and measured? What team members are
needed to utilize visualization? |
ENGINEERING TRACK 21 Visualization in Design/Build and Design/Bid/Build Project Environments
 Mark Taylor Mark Taylor
Audio/Visual Presentation
 Jim Bodi, Kiewit Western Co. Jim Bodi, Kiewit Western Co.
Audio/Visual Presentation
 Paul DiGiacobbe, Nave Newell, Inc. Paul DiGiacobbe, Nave Newell, Inc.
Audio/Visual Presentation
 Helen Peiker, Colorado Department of Transportation Helen Peiker, Colorado Department of Transportation
Audio/Visual Presentation
|
Description: The goal of the session is to present and discuss how 3D data and
visualization (wire-frame data or rendered models) can and are being used to expedite,
facilitate and support transportation construction activities. Panelists will present some
the latest developments and issues on this subject followed by facilitated discussion with
the audience. This session is intended to generate ideas and opportunities for action on
where the highway design and construction industry should go in terms of research,
development and technology (RD&T) to better support and leverage applications of the
emerging 3D and visualization to expedite construction of transportation projects. |
PLENARY SESSION 22 (THURSDAY)  Linking Transportation, Land Use, and Conservation Planning Through Decision Support
Tools Linking Transportation, Land Use, and Conservation Planning Through Decision Support
Tools
Patrick Crist, Manager of Conservation Planning Services, NatureServe
Audio/Visual Presentation
 Visualizing the World via Google Earth, Google SketchUp, and 3D Warehouse Visualizing the World via Google Earth, Google SketchUp, and 3D Warehouse
Mike Springer, Lead Software Engineer - Google
Audio/Visual Presentation
|
3D is increasingly becoming a standard - and expected - language for visualization. Google Earth,
Google SketchUp and the Google 3D Warehouse are tools for both the professional and the
consumer that help make 3D easier to create, visualize and share. Mike will share with us some
of the phenomenon surrounding Google Earth and Sketchup in the world of 3D, and explore the
opportunities for the future through new advancements such as 3D Warehouse. |
Doug Eberhard, Chief Technology Officer, Parsons Brinkerhoff
PRESENTATION NOT INCLUDED BY REQUEST OF SPEAKER
 Research Agenda of the TRB Visualization Committee Research Agenda of the TRB Visualization Committee
Dr. Ron G. Hughes, ITRE-NCSU
Audio/Visual Presentation
 Special Announcement s & Closing Remarks Special Announcement s & Closing Remarks
Extending and Visualizing Adjacent Work Zone Flows and Impacts
Shitij Mehta
Audio/Visual Presentation |
|
Papers contained in this web site are unedited and may not include revisions resulting from peer review.
The National Research Council was established by the National Academy
of Sciences in 1916 to associate the broad community of science and technology with the Academy’s purposes of furthering knowledge and of advising the Federal Government. The Council has become the principal
operating agency of both the National Academy of Sciences and the National Academy of Engineering in the conduct of their services to the government, the public, and the scientific and engineering communities. It is
administered jointly by both Academies and the Institute of Medicine. The
National Academy of Engineering and the Institute of Medicine were established in 1964 and 1970, respectively, under the charter of the
National Academy of Sciences.
The Transportation Research Board evolved in 1974 from the Highway
Research Board, which was established in 1920. The TRB incorporates all
former HRB activities and also performs additional functions under a broader scope involving all modes of transportation and the interactions of
transportation with society.
|
DISCLAIMER
The contents of this web site reflect the views of the authors who are responsible for the facts and the accuracy of the data presented herein. The contents do not necessarily reflect the official views or policies of the
Transportation Research Board, National Research Council, or the Federal
Highway Administration. These documents do not constitute a standard, specification, or regulation. Trade or manufacturers' names which may
appear herein are cited only because they are considered essential to the objectives of the conference. The U.S. Government and the TRB do not
endorse products or manufacturers. |